HARDWARE
SYSTEM
TRAJECTORY
AND SENSOR DATA FOR EACH NODE
The
final stage of this research was to execute
a test of the parasitic nodes by releasing them into a real-world situation.
More specifically, ten semi-passive, value-added, spherical nodes were given
orders and released into an environment populated by human hosts.
The
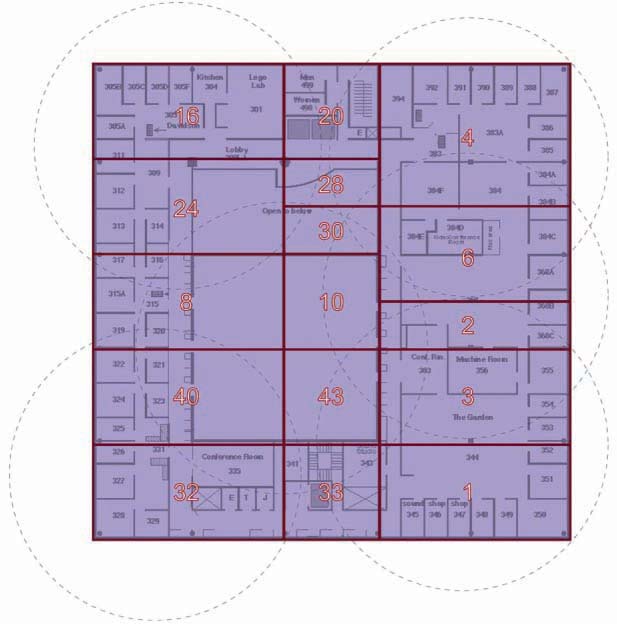
area selected for the test was the third floor of the MIT Media Lab. The floor
isusually inhabited by about 40 students/faculty and has light but steady
traffic through its pathways. In order to run the test, the floor was first
covered with 6 Bluetooth location beacons. With these 6 beacons and the areas
where two or three beacons overlap, the floor was divided into a grid of 16
distinct zones.
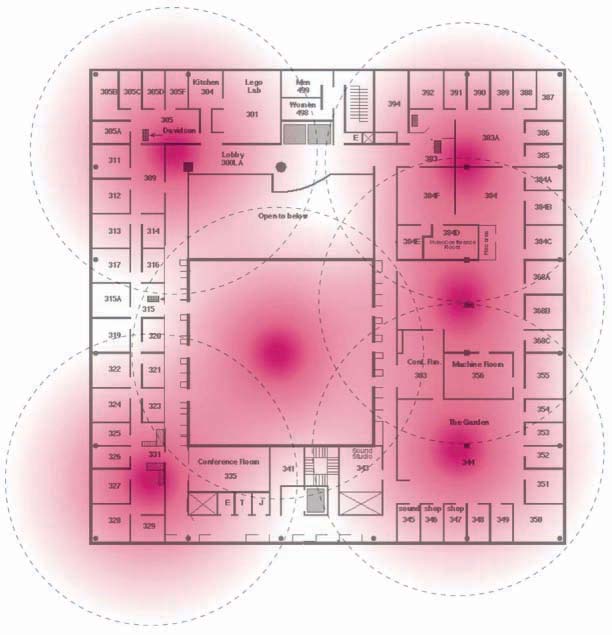
Bluetooth location
system coverage test area
The
nodes were then prepared, first by programming the application-specific firmware
into each node. This test application firmware uses all three identified states
(idle, attached, sensing) and specifically enables and disables peripherals
and alters the samplig rates accordingly. This allowed the application to
be optimized for power usage.
The
nodes were given specific behaviors. Of the ten nodes releasedm, six were
told to try and get to specific geographic locations using the distance checking
algorithm from the software simulator. The remaining four nodes were given
specific conditions to look for. All ten nodes constantly collected sensor
data throughout the test, but these four nodes were also programmed with desired
sensor conditions (e.g. bright lighting.)
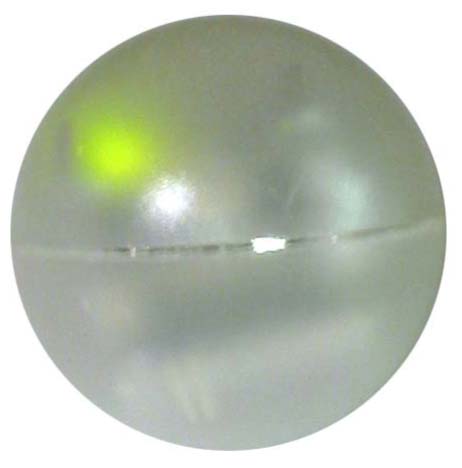
The
batteries were completely charged, and the nodes were sealed into their plastic
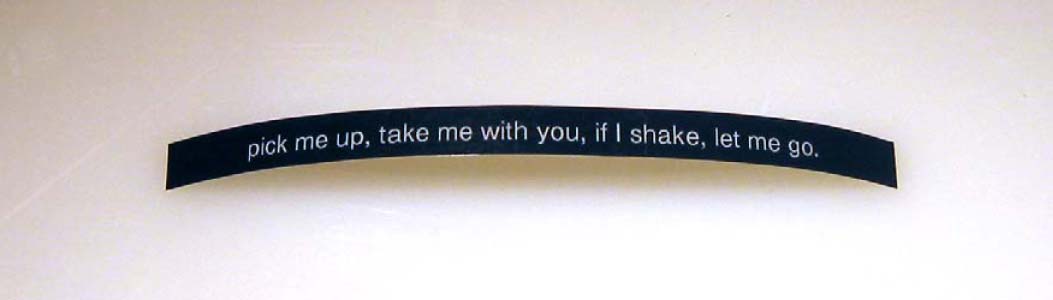
speheres and labeled with instructions. Detachment from the host involved
vibrating the pager motor and flashing a red LED in an attempt to be put down.
The
nodes were then deployed in a high-traffic hallway, and their positions were
monitored from any PC on the network. Within 15 minutes, all of the nodes
had found their way to a new location. Some were knocked around and rolled,
and some were picked up and brought to a new location. The people carrying
them mostly obeyed the device when it shook and wanted to be put down, sometimes
even tossing it away, startled by the vibration.
The batteries
lasted for about 4 hours. The nodes collected data on location, attachment,
state changes, sensors, and the time they reached their goals. The battery
that was used has a capacity of 145 mAh. The test incorporated many power
optimizations but also had many features enabled for logging and observation
of the test operation such as the constant flash writes, data dumps over the
wireless network, and health monitoring communications with the observer's
PC. Further power savings could be achieved by cutting the output power of
the radio transceiver from the Bluetooth's specified high power mode to its
normal output power mode.
The test generally
ran without a hitch, other than the disappearance of one of the ten nodes.
This is an expected loss considering the unknowns of the host’s behaviors.
The node was found one week later and its sensor data was recovered. Another
node got locked inside an office soon after deployment and remained there
for the duration of the battery life. One other node was discovered to have
manufacturing defests preventing it from recording data to the flash, so it
was removed from the test. The remaining eight nodes easily covered the test
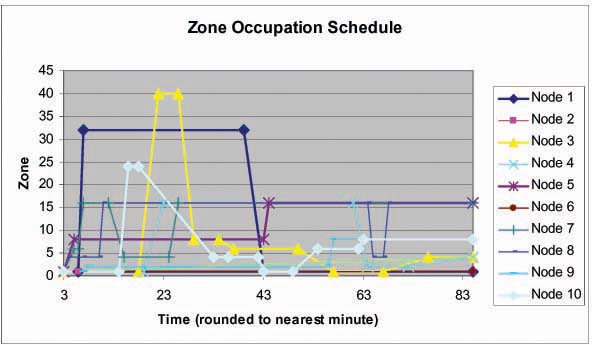
area. The Figure below shows which node was in which zone at what time.